Map navigation and tools
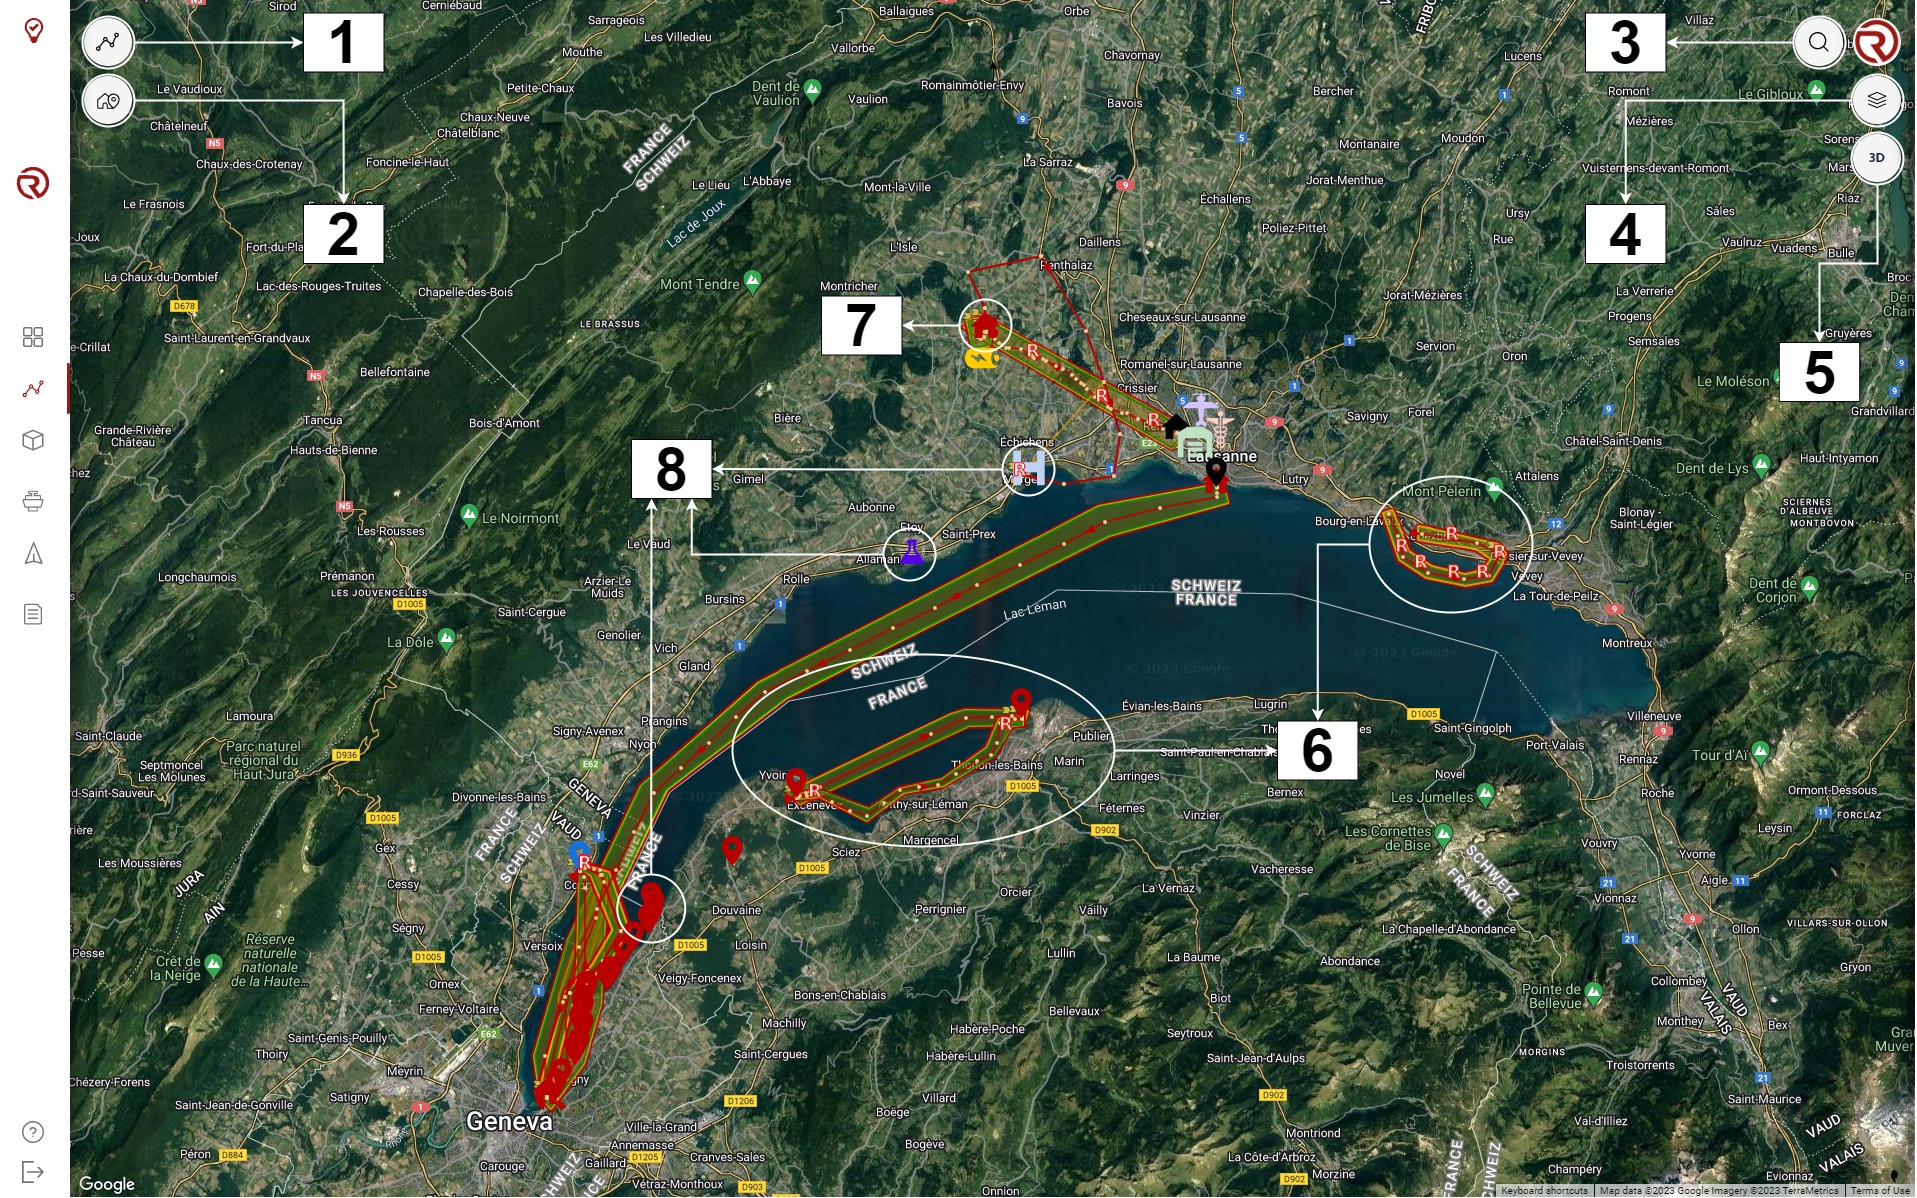
After accessing the Airbridge Planner, the map will be centred at the main base of the project. There are different options to navigate through this map:
- Mouse navigation: navigation is handled by clicking on the map with the mouse (left, right or middle-click) and zoom in/out by scrolling the mouse wheel or, respectively, by double-left-clicking or double-right-clicking.
- Keyboard navigation: navigation is handled with the arrows and zoom in/out with "+" and "-".
Depending on the filters, layers and content of the project, different elements can be displayed in the map.
- Routes: opens the "Bases, Markers and Routes" menu in the "Routes" module, where the user can plan new routes and see/edit existing ones (see Bases, markers and routes).
- Bases and markers: opens the "Bases, Markers and Routes" menu in the "Markers" module, where the user can create/modify bases (see Bases, markers and routes).
- Search box: opens a box in which the user can search for specific locations. The search can be confirmed by clicking "Enter" in the keyboad. A list of available options will be shown and the map will be centred at the desired location after left-clicking on it. To start a new search, the user shall click twice on the icon.
- Layers and map tools: opens the "Layers and map tools" menu, where the different map layers and filters are available, as well as a set of tools that can help the user to prepare flight plans and share them (see Layers, filters and map tools).
- 3D View: switches to 3D view (see 3D View).
- Examples of different routes
- Example of a base
- Examples of different markers
Layers, filters and map tools
By clicking on the "Layers and map tools" button, a new menu opens at the right side of the window offering new options to use RigiCloud Airbridge Planner, including metric tools, filters and layers.
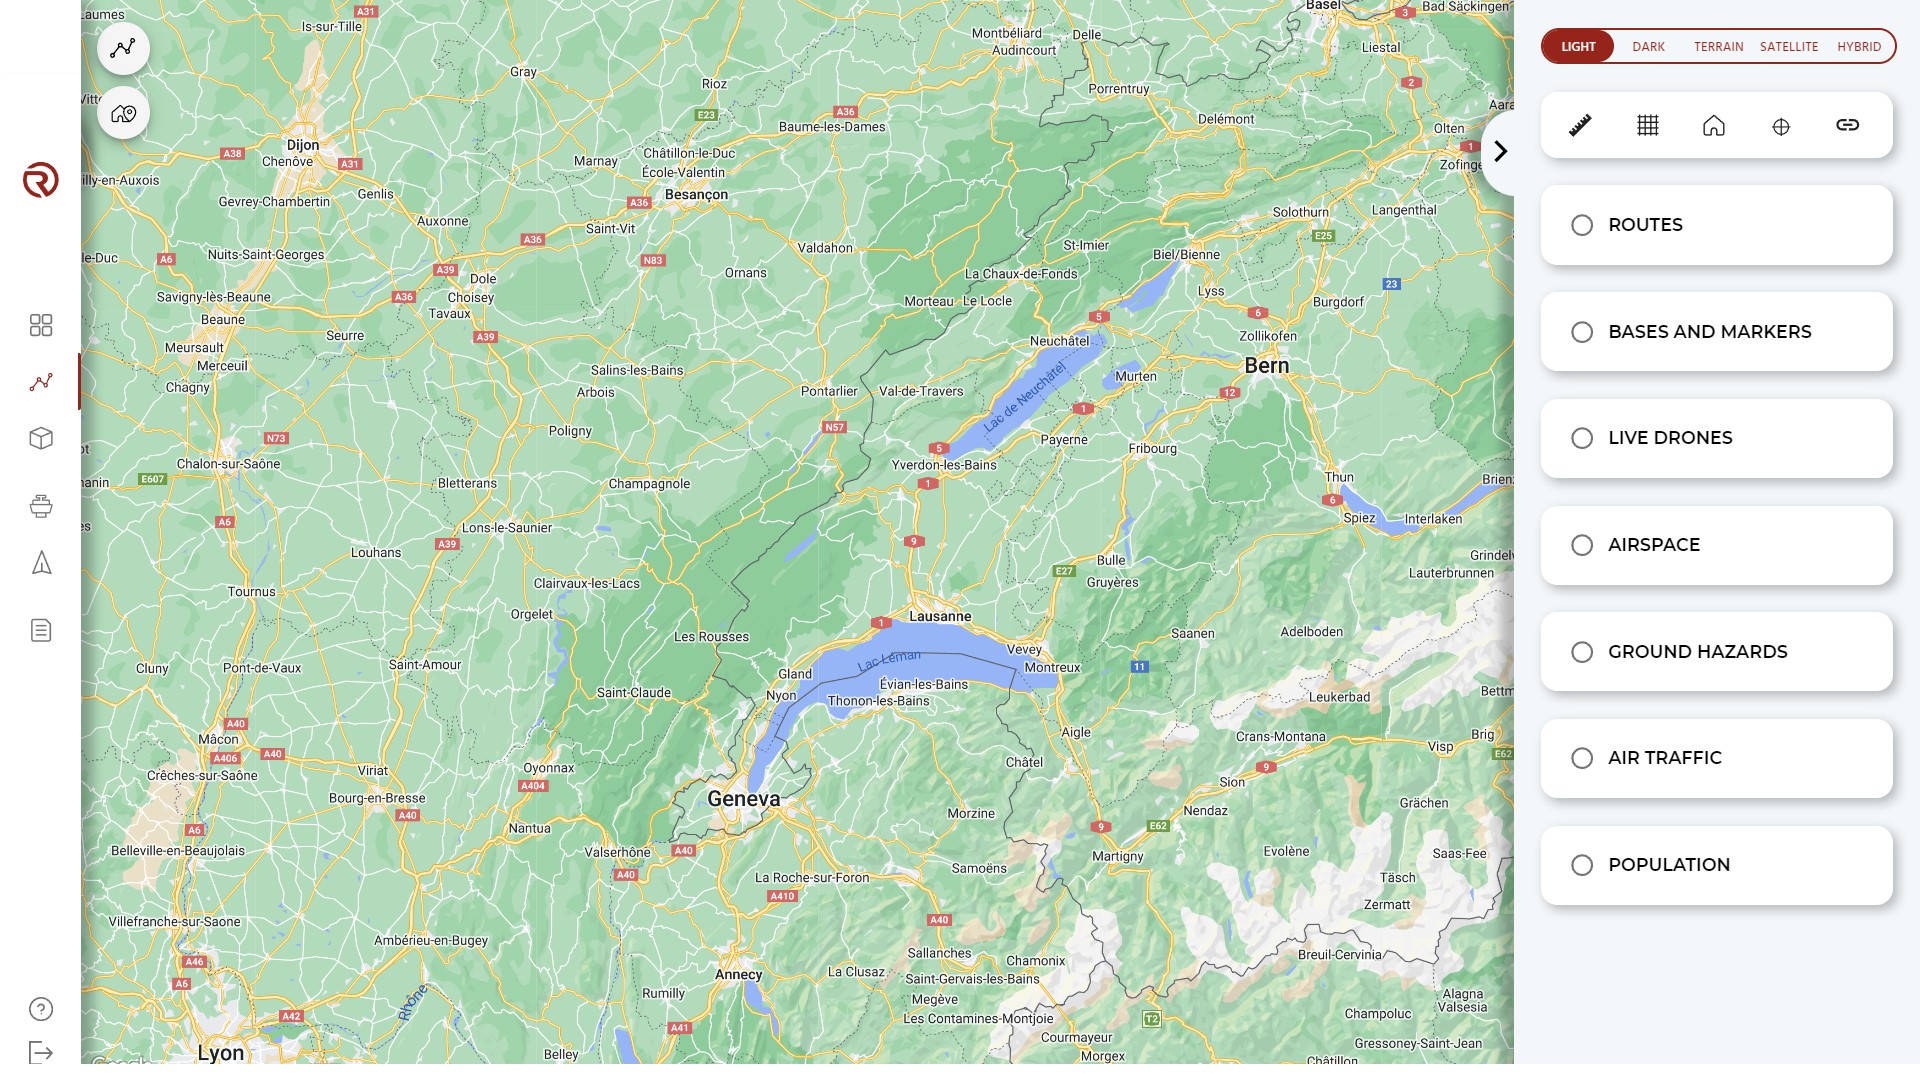
Map layers: allows to switch the map layer between the four possibilities (see Layers).
Map tools: RigiCloud offers a set of tools that can be used for planning, navigating through the map or sharing the project with other stakeholders.
- Ruler: opens the ruler tool, which can help to measure distances (see Ruler).
- Grid: opens the grid tool, which displays a square grid in the map (see Grid).
- Centre map to network: centres the map on the main base.
- Centre map to current location: centres the map on the the user's current location.
- Copy share link: creates and copies a link that can be sent to other stakeholders of the project with a restricted view of the project.
Routes: allows to show/hide the routes and/or specific elements of the routes. Specific elements available are:
- Path (lines between waypoints)
- Geocages (includes geocages, pre-geocages, ground buffer, etc.)
- Waypoints
- Rally Points
Bases and Markers: allows to show/hide bases and/or markers. Specific elements available are:
- Base
- Marker
Live drones: allows to show/hide drones, simulators and/or Edge Nodes. Specific elements available are:
- Drones
- Simulators
- Edge Nodes
Airspace: allows to show/hide information of the airspace (see Airspace).
- Note: this feature is currently not supported.
Ground hazards: allows to show/hide information of the ground hazards (see Ground Hazards).
- Note: this feature is currently not supported.
Air Traffic: allows to show/hide air traffic detected by available systems and filter them (see Air Traffic).
Population: allows to show/hide population density data (see Population).
The airspace, ground hazards and population filters include the following options and messages:
- Data source: refers to the data source of the layer.
- Layer opacity: modifies the opacity of the layer.
- Auto update: enables/disables the automatic update of the layer when the position or zoom of the map is changed. It is useful to disable it when the required data have already been displayed in order to make a more efficient use of the resources and reduce the time delays.
- Under certain conditions, the following messages can be displayed within the filters:
- "No data": there are no available data in the displayed region of the map.
- "Zoom in": the user shall zoom in to have the layer displayed.
Layers
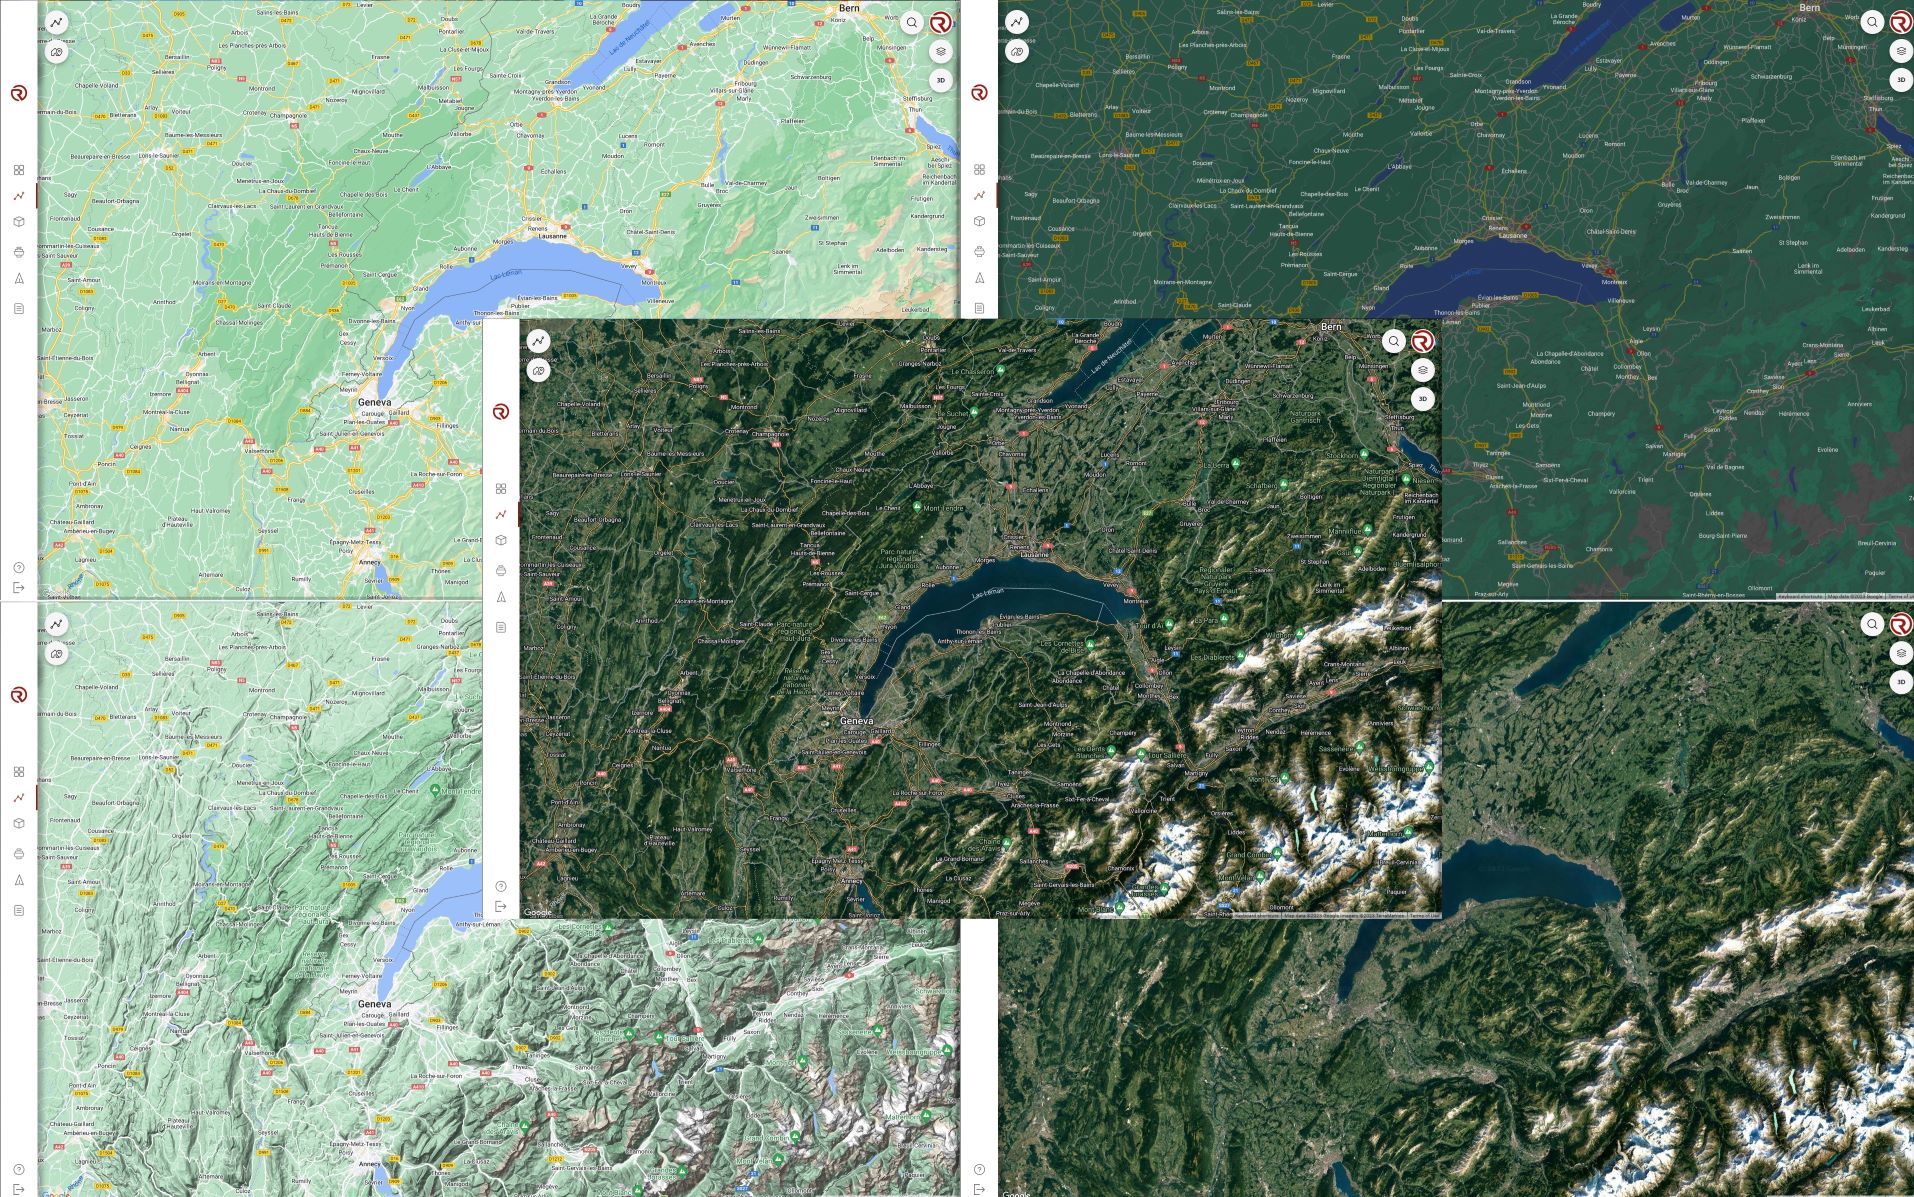
There are four types of layers:
- Light: minimalistic light view with minimum information. Most suitable for general operations in order to reduce the amount of information displayed on the screen.
- Dark: minimalistic dark view with minimum information. Most suitable for general operations in order to reduce the amount of information displayed on the screen.
- Terrain: map view with terrain information. Most suitable for flight planning with important deviations in altitude. Can also be suitable for operating with these flight plans.
- Satellite: map with satellite imagery only. Most suitable for general operations in order to reduce the amount of information displayed on the screen.
- Hybrid: map with satellite imagery and geographic information. Most suitable for planning, especially in/near urban environments. It can also be used for operations, especially in case of accidents or fly-aways (to better identify the position), although the amount of information displayed on the screen might decrease the remote's crew reaction during operations in crowded environments.
Airspace
This feature is currently not supported.
Airspace structures for different countries are available and obtained from an external source (Altitude Angel - Airspace):
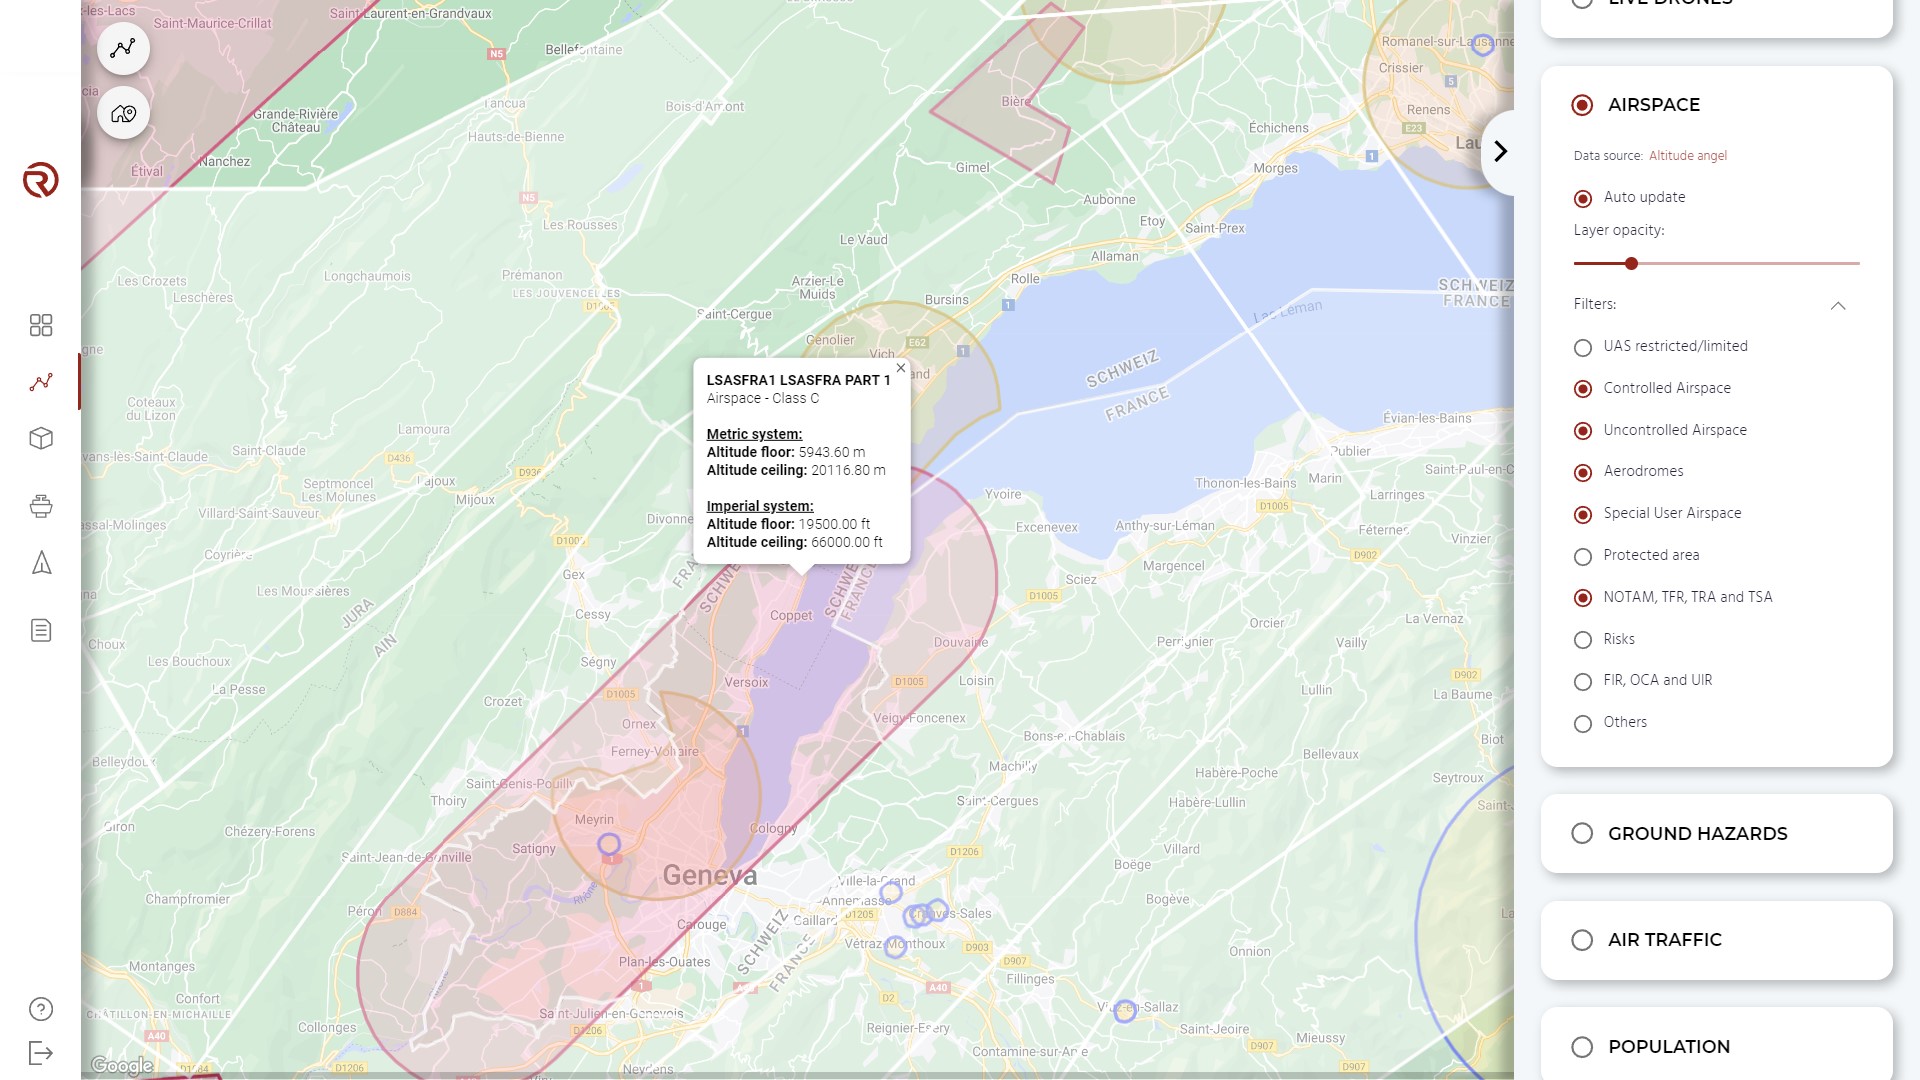
Within the Airspace, it is possible to:
- Show/hide all the airspace.
- Enable/disable Auto update.
- Modify the layer opacity.
- Expand/collapse individual filters.
- Show/hide individual filters.
By left-clicking on an airspace hazard structure, additional information may be available (name, type, floor and ceiling of the structure).
If no data is being shown, it may be necessary to zoom in.
Ground Hazards
This feature is currently not supported.
Ground hazards for different countries are available and obtained from an external source (Altitude Angel - Ground Hazards):

Within the Ground Hazards layer, it is possible to:
- Show/hide all ground infrastructures.
- Enable/disable Auto update.
- Modify the layer opacity.
By left-clicking on an air/ground hazard structure, additional information may be available (floor and ceiling of the structure).
If no data is being shown, it may be necessary to zoom in.
Air Traffic
Air traffic information can be obtained through two main sources:
- INVOLI: live information obtained through Involi network and/or ground receivers (when installed).
- Note: ULM, paragliders and parachute are represented with the same icon (a parachute/paraglider).
- RigiTech: on-board TCAS (when installed in the UAS). More details on air traffic detection will be given in Air traffic detection.
Disclaimer:
- The operator shall consult official local sources when planning operations.
- The operator shall consult with their competent authority what means are acceptable to ensure proper air traffic detection.
- RigiTech is not responsible for any airspace or ground infrastructure not evaluated by the operator.
- RigiTech is not responsible for any aircraft not detected through the available means.
Within the Air Traffic layer, it is possible to:
- Show/hide all the available air traffic information.
- Filters the available air traffic information based on the altitude range (in m AMSL).
- Filters the available air traffic information based on the source of the information.
- INVOLI and RigiTech: show/hide any aircraft globally detected through all the available technologies.
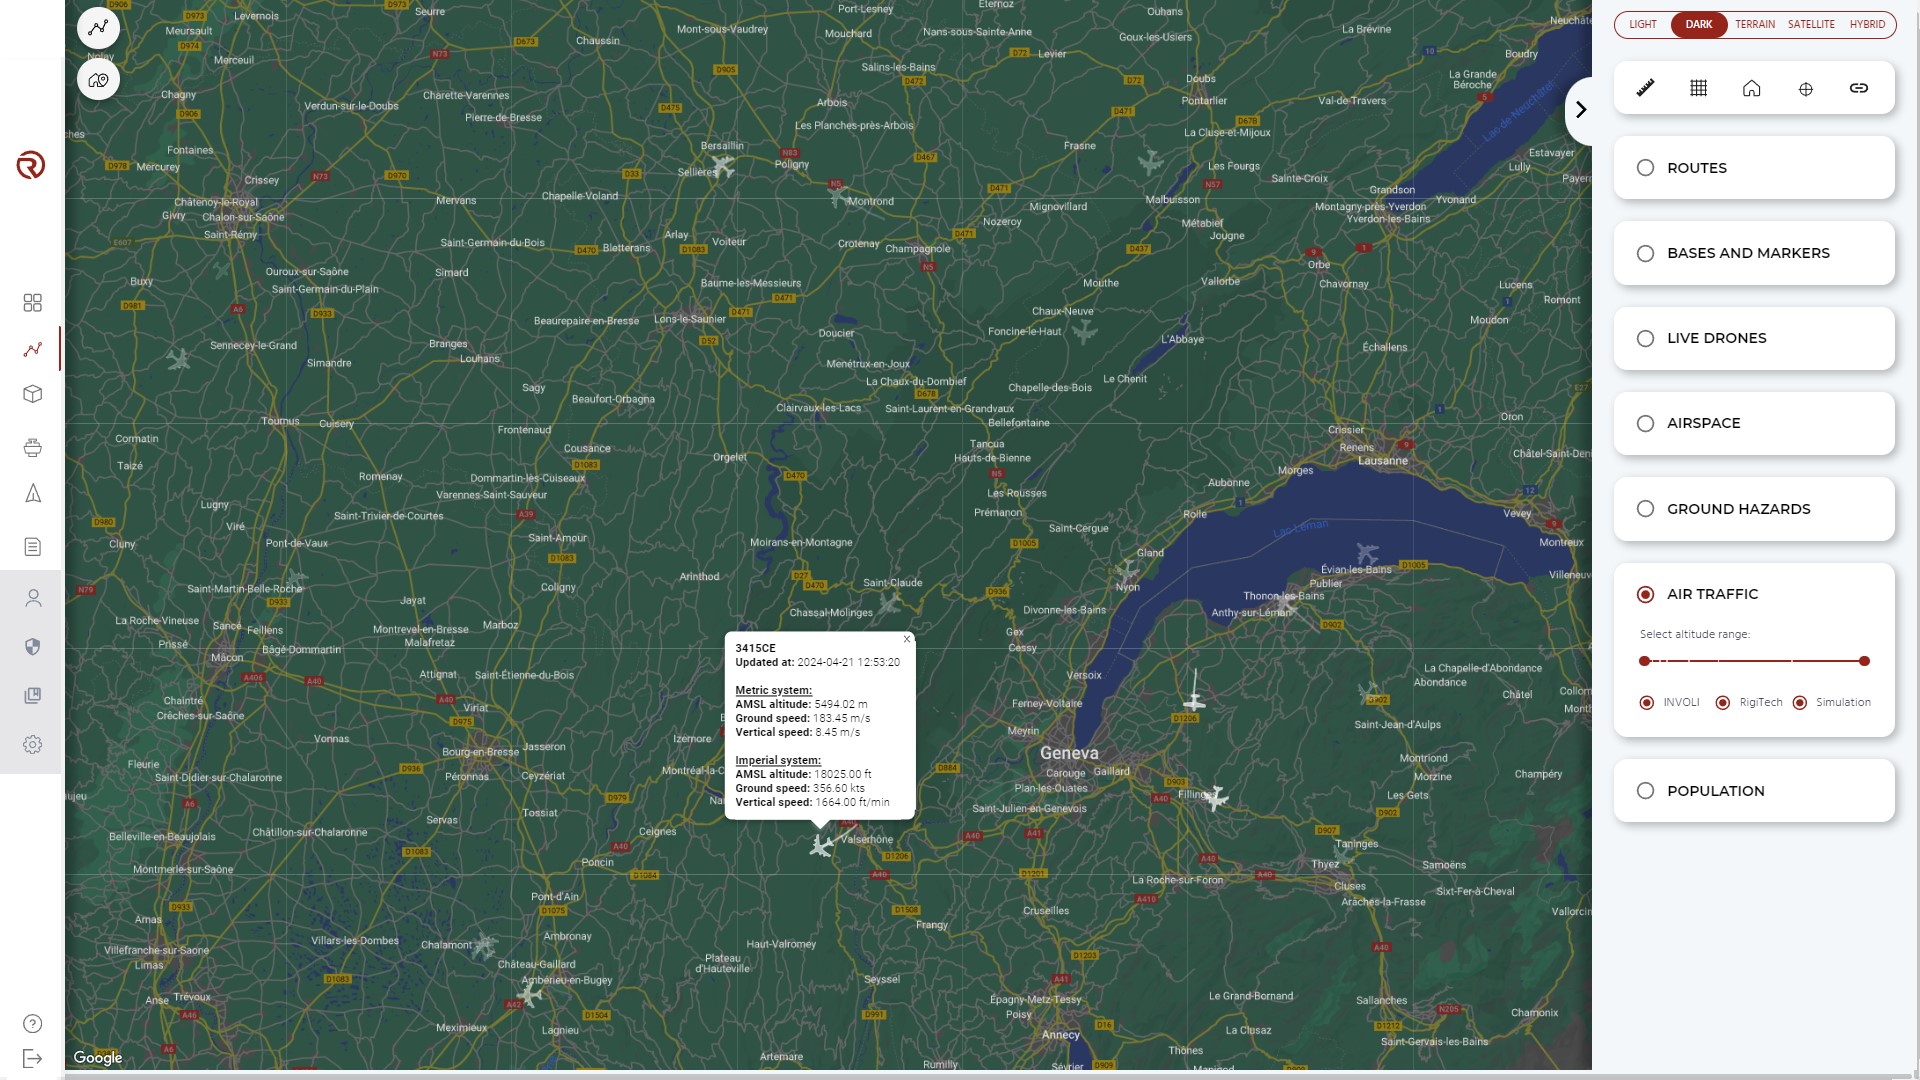
By left-clicking on a detected aircraft, its trail for the last 30 seconds will be shown.
By right-clicking on a detected aircraft, additional information may be available (floor and ceiling of the structure).
- ID of the aircraft.
- Time of the last update.
- Metric system information:
- AMSL Altitude (in m)
- Ground speed (in m/s)
- Vertical speed (in m/s)
- Imperial system:
- AMSL Altitude (in ft)
- Ground speed (in kt)
- Vertical speed (in ft/min)
Population
RigiCloud integrates population density information obtained from external sources:
- World data: Global Human Settlement Layer
- France: Géoportail
Disclaimer:
- The operator shall consult with their competent authority what sources are acceptable to ensure proper population density identification.
- The operator shall evaluate the real number of people at risk during operations.
- RigiTech is not responsible for any decision taken by the operator due to the interpretation of the used population density information.
Within the population layer, it is possible to:
- Show/hide the population layer.
- Enable/disable Auto update.
- Select the Population data source.
- Depending on the zoom and the source, there are different sizes of squares:
- World data (Global Human Settlement Layer): based on the latitude (3 and 30 arcsec).
- France (Insee FiLoSoFi 2019): 200 m and 1000 m.
- Depending on the zoom and the source, there are different sizes of squares:
- Modify the layer opacity.
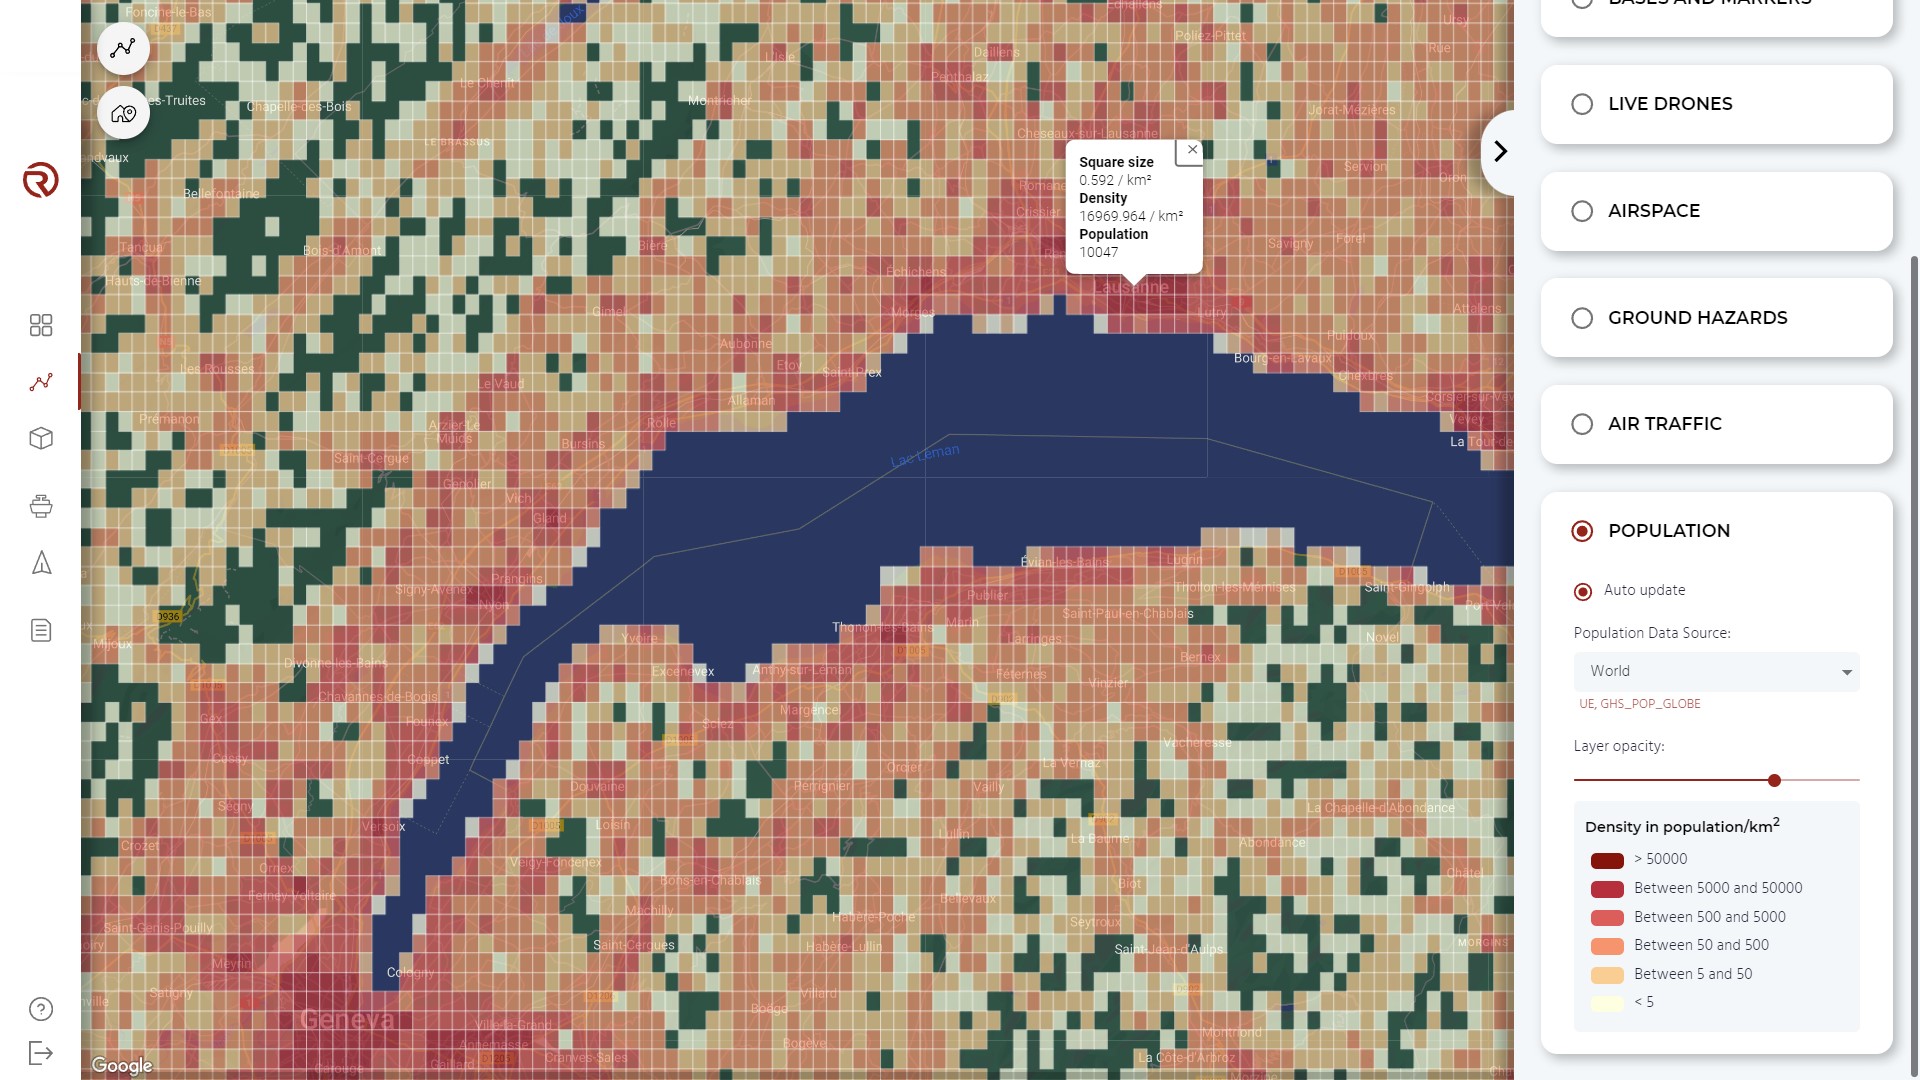
- See the legend of the layer.
- The levels of population represented are:
- Below 5 hab/km2
- Between 50 and 500 hab/km2
- Between 500 and 5000 hab/km2
- Between 5000 and 50 000 hab/km2
- Above 50 000 hab/km2
- Depending on the source and the projection of the data, the population density is represented by squares of different colours from pale yellow to dark red.
By right-clicking on any square, additional information may be available (floor and ceiling of the structure).
If no data is being shown, it may be necessary to zoom in.
Additional Tools
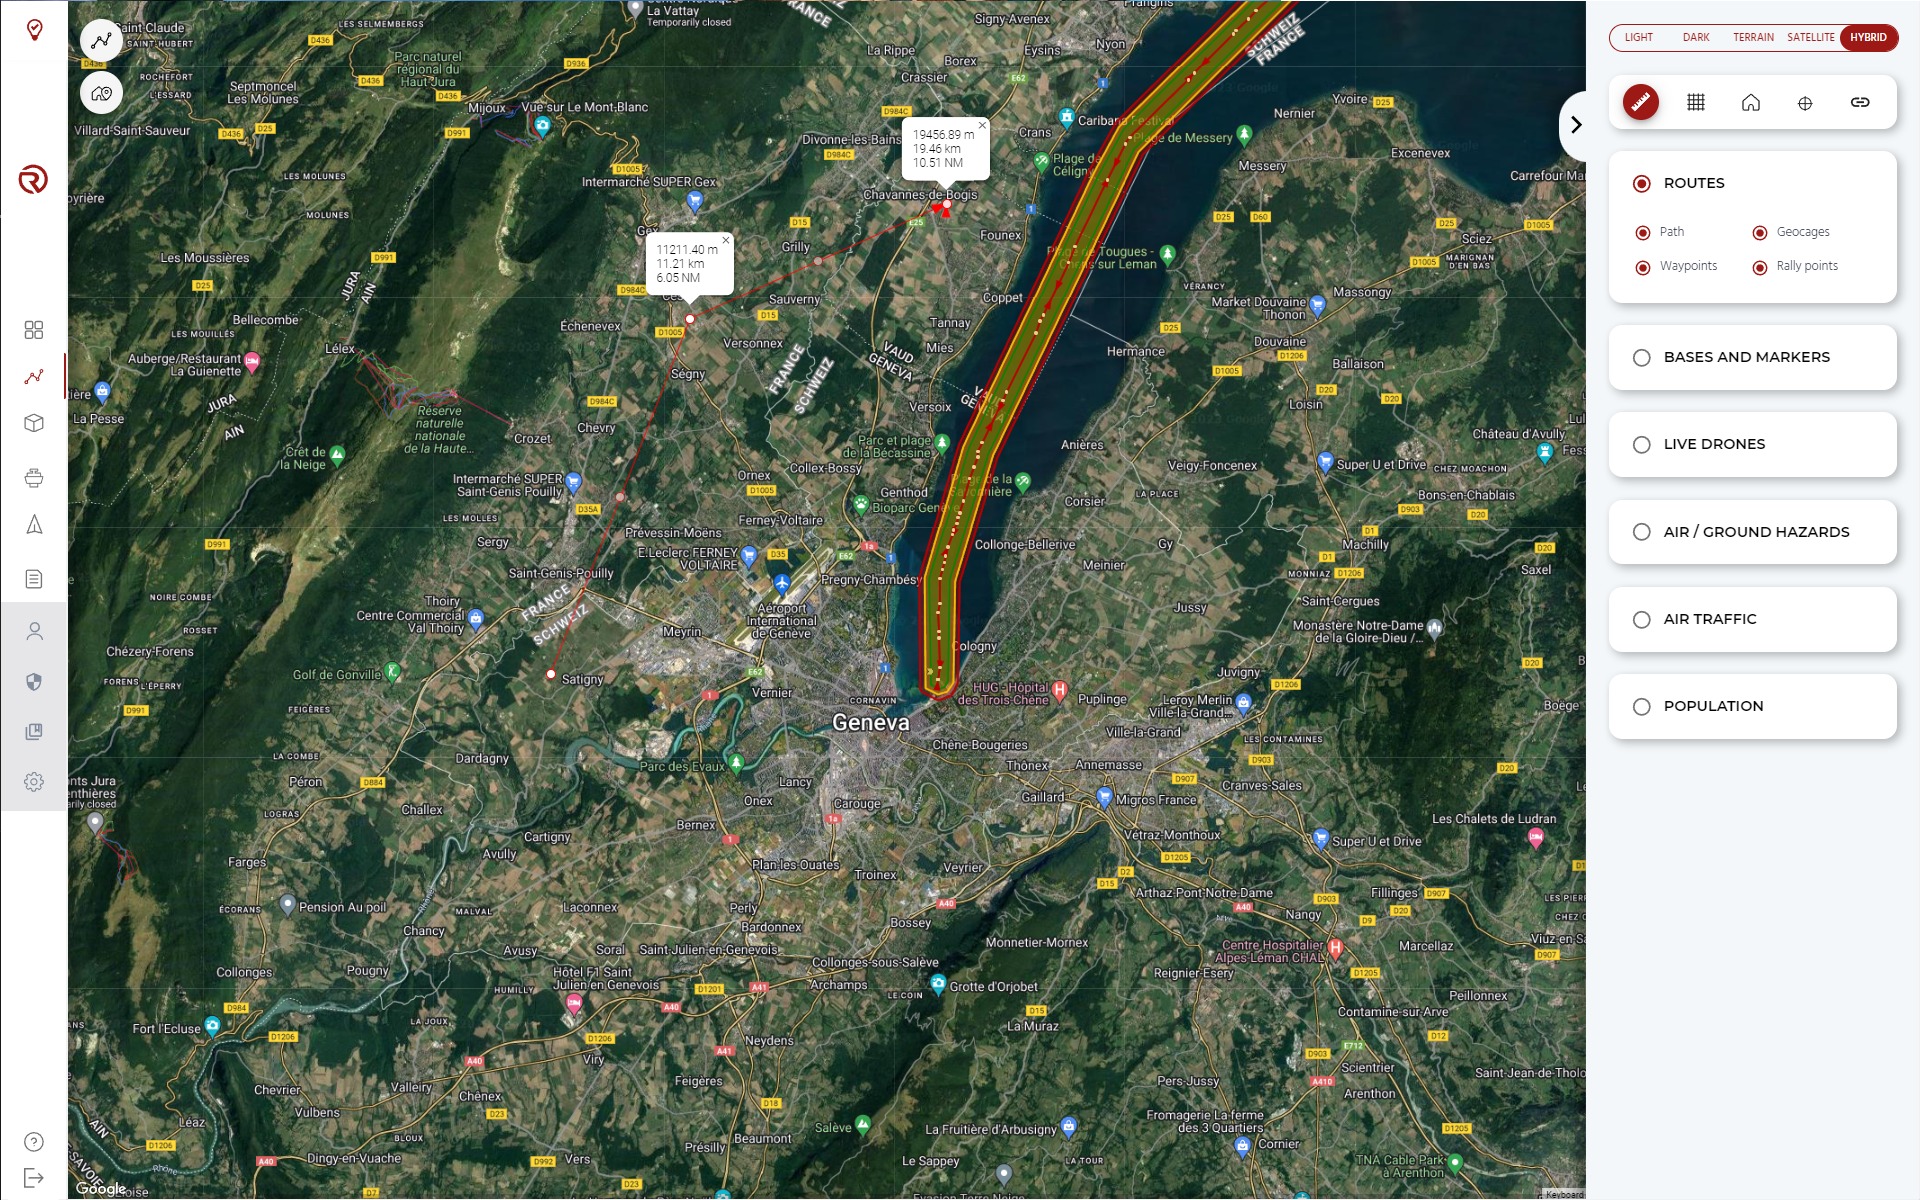
Ruler
The ruler tool allows to measure distances between two points, as well as measuring the total distance of a sequence of points.
In order to use the tool, the user shall clik on its icon in the "Layers and map tools" menu. Then, click on the desired location in the map, which should be an empty location (i.e., with no other map elements such as waypoints, bases, markers, etc.). A dotted arrow will be displayed with a text box with the distance measured (in m, km and NM).
By clicking on a second location, the distance between the two first points will be fixed and will now be able to add a third point. The measure apearing in the new text box counts the total distance of the sequence of points.
By repeating this process, it is possible to add multiple points and know the sequencial distances.
- How to add a point: A new point can be added by left-clicking on an empty location in the map. An empty location is a location without other map elements (bases, markers, waypoints, rally points, vertices of geofences, etc.).
- How to remove a point: A point can be removed by right-clicking.
- How to erase a sequence of points: A sequence of points can be erased by following any of the next procedures.
- Clicking on the "X" in any text boxes.
- Clicking the "Esc" of the keyboard.
- Clicking on the "Ruler" button in the "Layers and map tools" menu.
When using the ruler tool, the following elements will be displayed:
- Point: After clicking on any empty space of the map, a new point will appear. The last point created will be the origin of a new dashed arrow. If a new point is created, the previous arrow will be fixed and a new dashed arrow pointing to the mouse will appear.
- Text box: Displays the distances between a given point and the previous one (if the given point is the second one), the distance of the sequence of points up to the given point (if it is a point between the second and the last one) or the total distance of the sequence of points (over the mouse position, before creating a new point).
This tool is particularly useful when an exact measure of the distance between the route and other elements is needed, such as buildings, roads or other infrastructure.
Grid
When the measure or estimation of multiple distances is needed, instead of using the ruler case by case, it might be more efficient to use the grid tool.
This tools displays a grid in the map for which the user can choose its length (between 10 m and 12 km) and angle.
In order to use it, the user shall click on its button in the "Layers and map tools" menu, and a new submenu will be displayed, allowing to modify the parameters of the grid.
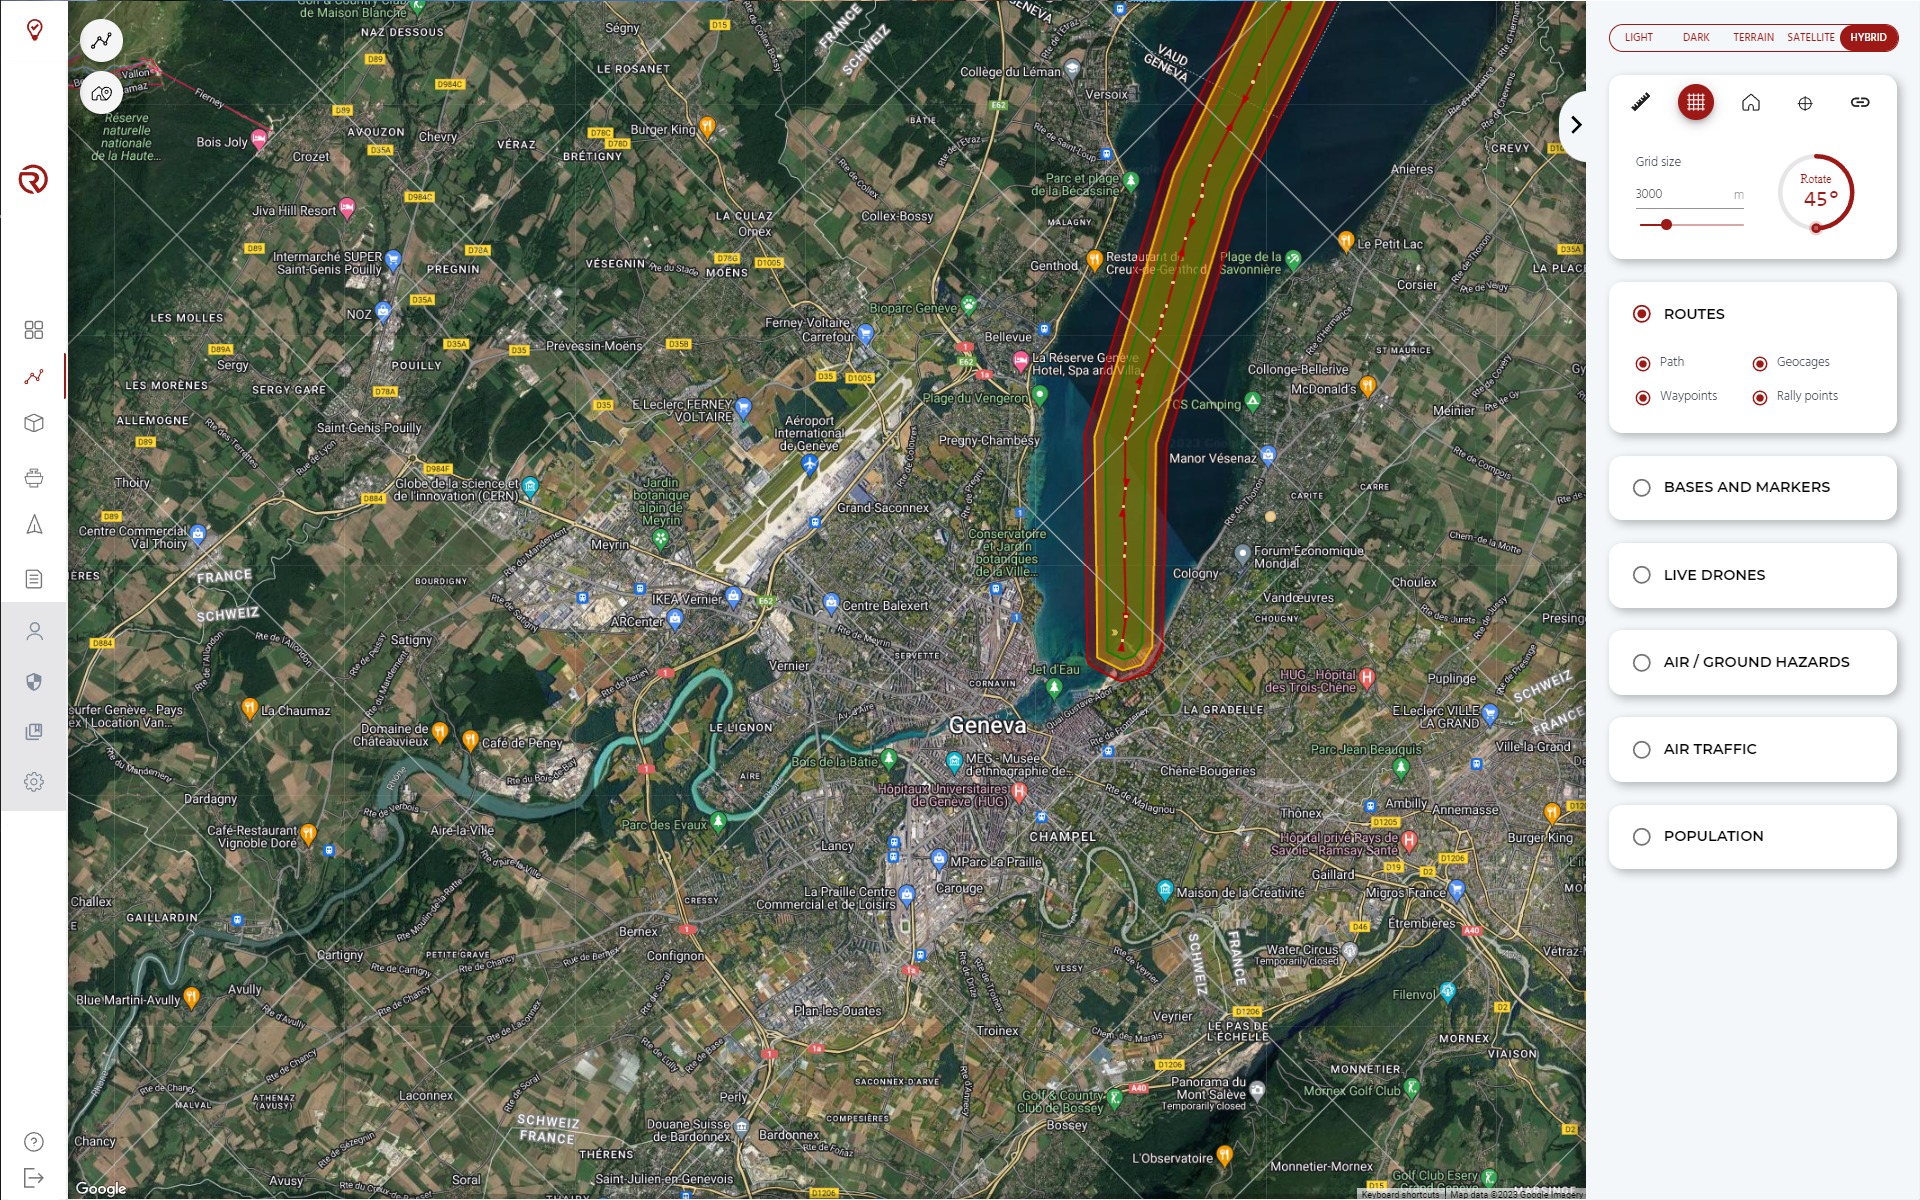
When using the grid tool, the following elements will be displayed:
- Grid size: The size of the squares of the grid can be modified (between 10 m and 12 km) by entering manually a number or by chosing the desired value with the scrolling bar. If the numbers of the grid size are erased, the value will be set automatically at 10 m.
- Grid angle: Allows to rotate the grid between 0º and 90º.
- Reference point: Allows to modify the reference point of the grid by clicking on the orange circle in the map and dragging it. This point is not necesarilly attached to the vertex of one of the squares of the grid.
This tool is particularly useful when planning operations. It is possible to first set a geocage and then have the grid in the same direction of the geocage in order to have set the waypoints in the middle of the geocage. It is also possible to do the opposite and align the grid with the flight plan and prepare the geocage with the help of the grid.
The tool is also fitted to obtain quick estimations of the distance between the flight plan/operational volume with relevant infrastructures (such as the runways of an airport), mountains, shores, etc.
Finally, the tool can also be used to show relevant distances of the operational volume/ground buffer with urban environments, infrastructure, etc. and take pictures to support the operational risk assessment.
Additional comments:
- The size of the grid is limited to 80 x 80 km2. If the zoom is too small, the grid might not cover the whole space.
- If the grid size is small with a small enough zoom, the computer could be slowed down. It is advised to adjust the size of the window, the size of the grid and the zoom to have less than 100 squares visible per row.
- Every time the grid is turned on, its reference point is set in the centre of the map.
- If the position of the map is moved, a section of the grid and its reference might be lost. In order to avoid this, the user can simply turn off and turn on the grid.
3D View
RigiCloud allows to see the flight plan (including other elements, such as bases and markers) in a 3D view and assess if the waypoints and geocages are well defined and coherent with the terrain. The tool can also help to find the best trajectory in order to fly above/between mountains, in order to avoid regions that could be specially affected by chaotic winds.
Disclaimer:
- The 3D View does not include artificial and natural obstacles.
- The operator shall consult with their competent authority what sources are acceptable to ensure proper obstacle avoidance.
- The operator shall evaluate the presence of obstacles in their operational volume and plan operations accordingly.
- RigiTech is not responsible for any decision taken by the operator due to the interpretation of the 3D View.
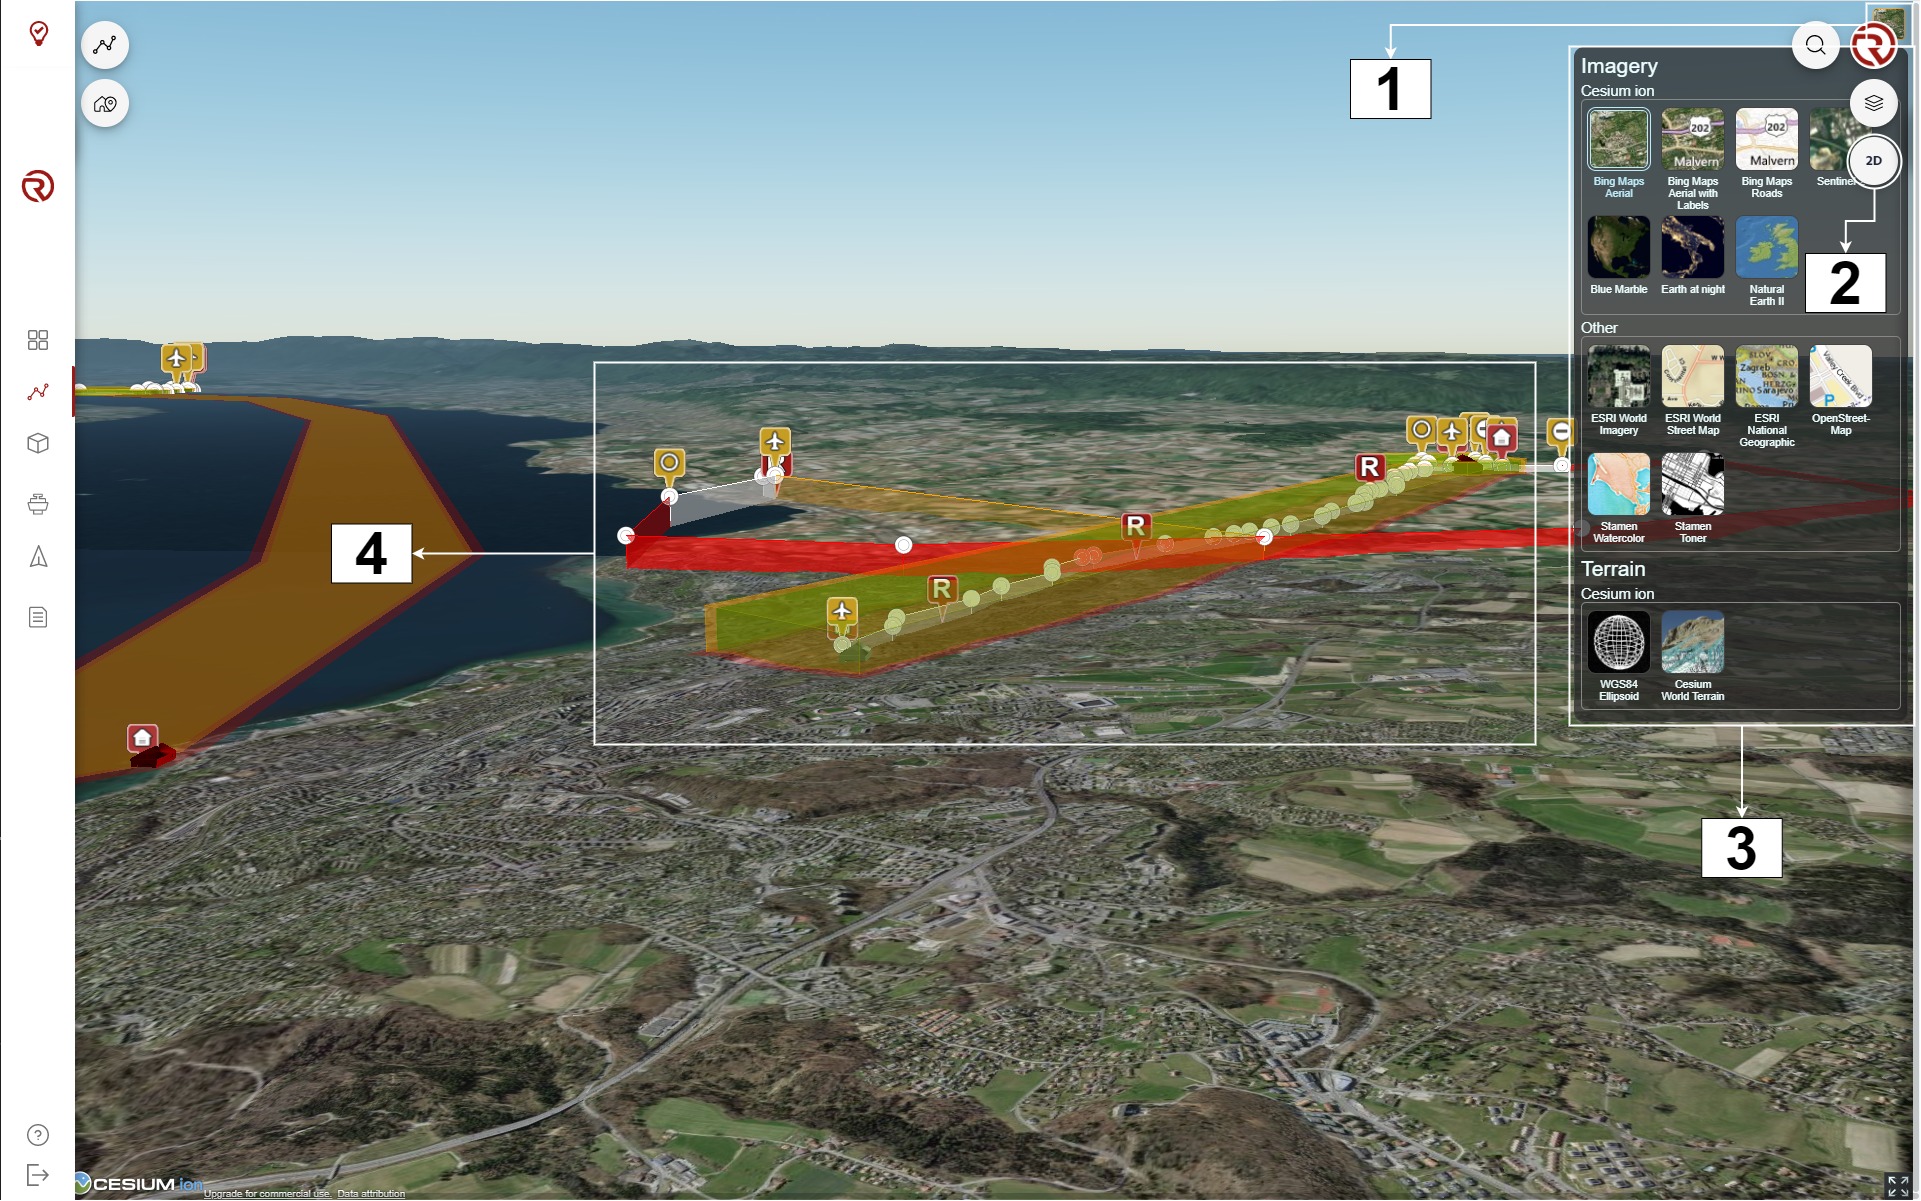
- Imagery: opens the imagery selector.
- Switch to 2D: allows to switch back to 2D view.
- Imagery box: allows to select the imagery source of the 3D and altitude view.
- Example of a flight plan represented in 3D