Dashboard
Overview
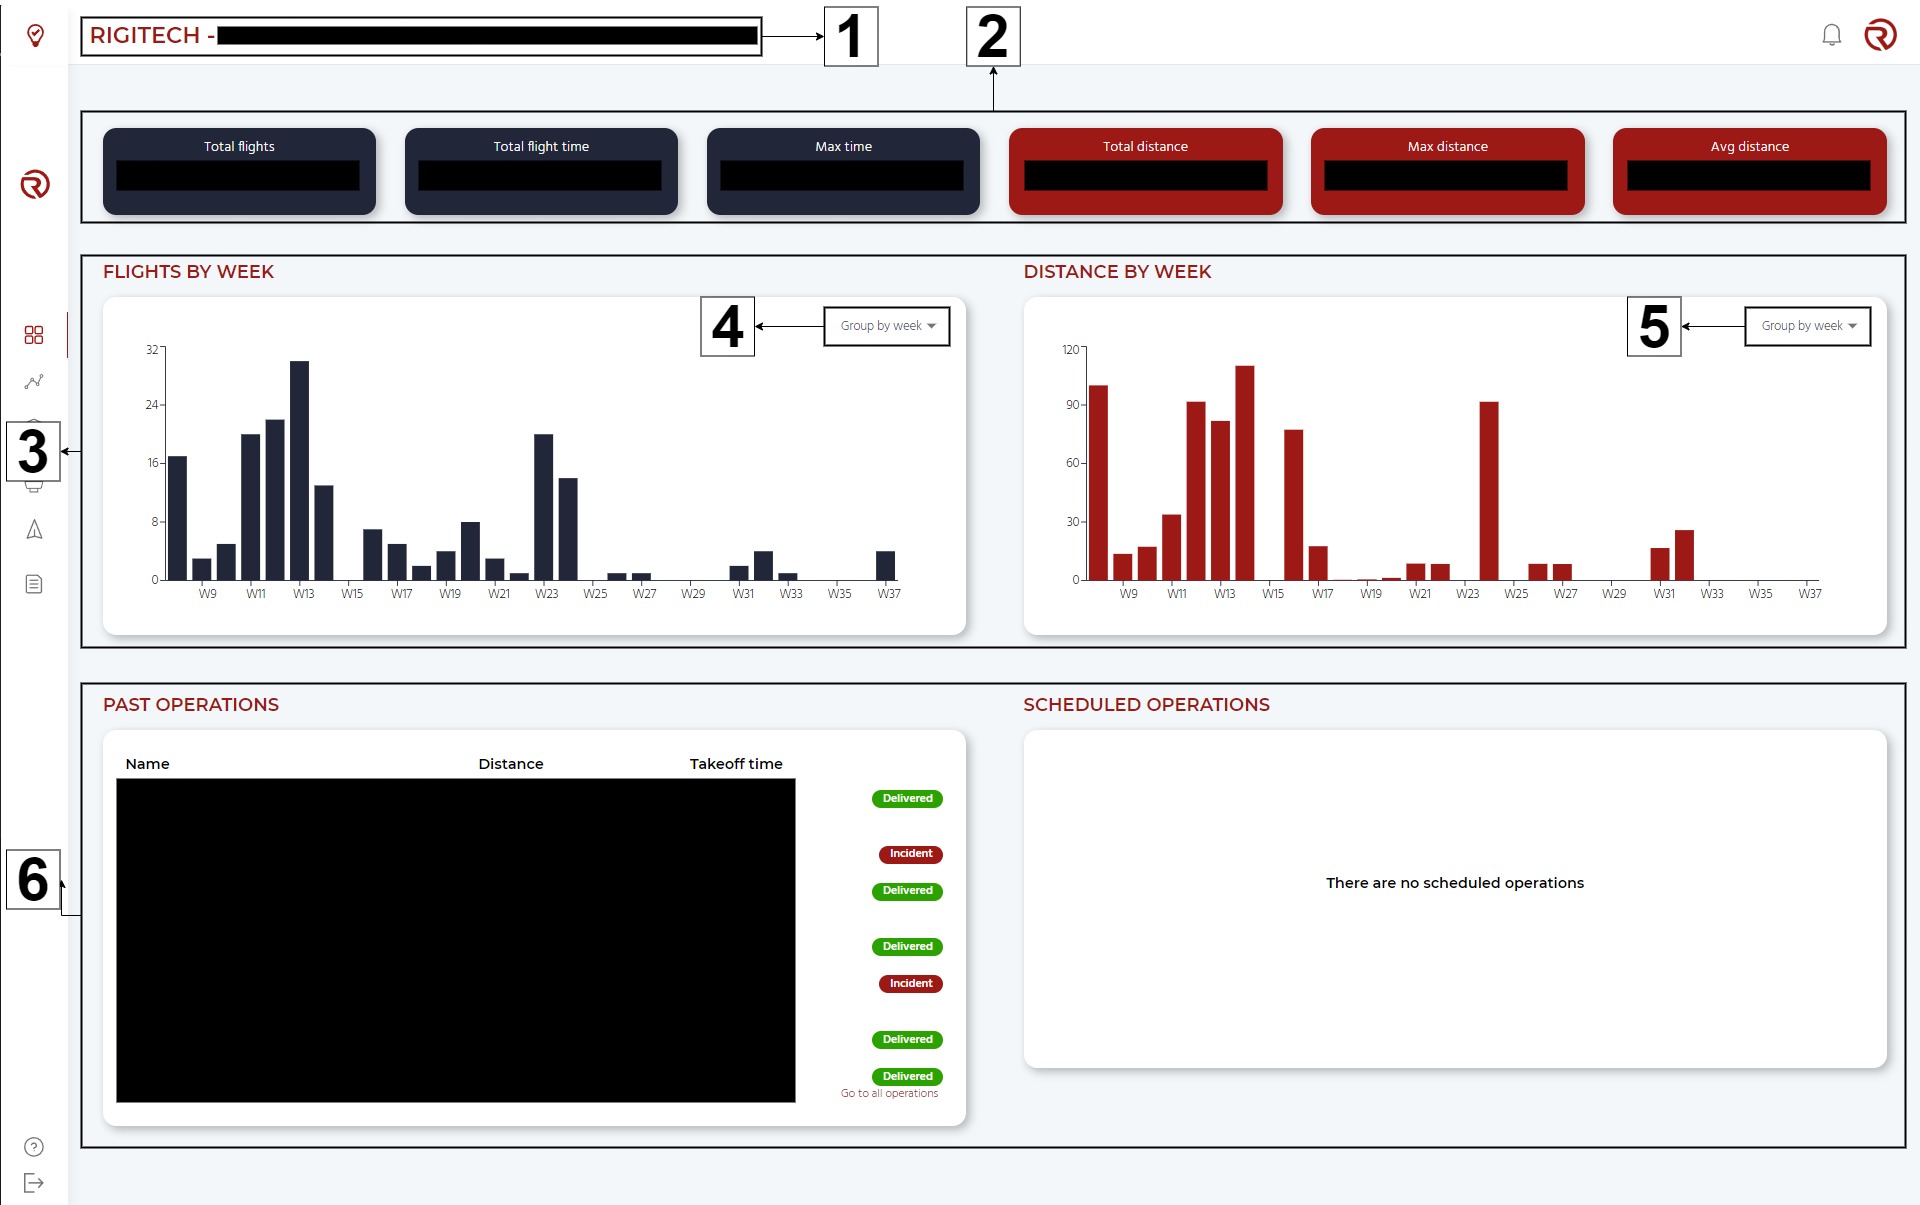
The dashboard module is, by default, the first module showed in RigiCloud when accessing it. In this module, the overall statistics of the operations and flights are available.
- Name of the project
- Flights and distance - Summary: Summary of the flights. From left to right:
- Total flights: Shows the total number of flights.
- Total time: Shows the total time flown.
- Max time: Shows the time of the longest flight (in terms of time).
- Total distance: Shows the total distance flown.
- Max distance: Shows the distance of the longest flight (in terms of distance).
- Avg distance: Shows the average distance flown per flight.
- Flights and distance - Graphs: Summary of the flights (left) and distances flown (right) grouped by different time categories.
- Type of grouping (for flights)
- Type of grouping (for distances)
- Information on past and scheduled operations: Summary of the past (left) and scheduled (right) operations.
- From left to right, Past operations show the name of the operation, the vehicle used, the distance (and time) of the flight, the start time and the status of the operation.
- From left to right, Scheduled operations show the name of the operation, the route selected and the scheduled time.
Flights and distance - Graphs
In this section of the page, two graphs are displayed: flights by time grouping (left) and distance by time grouping (right).
For both graphs, the x-axis corresponds to the units of the time grouping, while the y-axis represents the main unit of the graph (flights or distance).
The different time groupings available are:
- Group by day
- Group by week
- Group by month
- Group by quarter
- Group by year